This is a long one! But it summarizes quite a bit of information that relates directly to social distancing policies, and what sorts of decisions our public officials are (or should be) making. I have a couple more post topics lined up which should be shorter, one about vaccine development, and another about possible treatments that people are in the news right now. Look for those to show up over this coming week!
Numbers
So many numbers fill our lives now. Personal numbers, like how many rolls of toilet paper are in the house (17), how many weeks the kids haven’t been to school (2), how many puzzles we’ve put together (4), how many hours of screen time for the kids each day (3 to 9, depending on the day). Community numbers, like how many packages of toilet paper the local grocery stores have (0), how many time zones my students are now in (7), how many cases of COVID-19 have been reported in my county (119 as of yesterday). National and global numbers on reported coronavirus cases, fatalities, and recoveries, stock market gains and losses, unemployment filings, bailout packages… Numbers can make us feel safe and so we underestimate risk, thinking that the problem belongs to someone else (another country, another town, another age group). Numbers can make us feel anxiety, leading us to hoard food, toilet paper and guns (follow this link for a good post about this.) Numbers can make us feel powerless, that our behaviors ultimately don’t matter so there is not point in changing them.
The real power in numbers is that they can be used to make predictions, allowing us as individuals, communities, and countries to make decisions that can change outcomes, and then holding steady in those decisions even when the results are slow, or may even cause some harm. Using numbers in this way is hard. It requires that we resist falling into a sense of safety or of defeated anxiety, and that we do not jump to conclusions when interpreting new numbers. It takes discipline to remain cautious and steady in this extended moment of stress, discipline to look at the numbers from what has already happened and use them to model, or forecast, what might happen next, and how our actions in this moment can impact that future. It also takes discipline to acknowledge, to ‘face up to’, the reality that all decisions will have impacts, impacts that can cause harm, and to still find the best path forward among many ‘sub-optimal’ options. Even when those decisions may affect us negatively for weeks or months before we know if they have worked, or not.
Numbers and the coronavirus pandemic
Numbers are hard, numbers are confusing, and numbers don’t always show a clear path forward. I don’t understand how to look at business numbers (unemployment, stock market, negative growth) so I rely on others to help me see which of today’s changes may truly have a lasting negative impact, and which may have more unpredictable or short-lived effects. On the other hand, I do have experience digging through science research articles for useful data. I have been doing just that for coronavirus data since late January, so I’d like to share with you what I see in the numbers. I’ve been working on this particular blog post for three or four days, and every day I keep finding new useful numbers, and it is hard for me to feel like I have finished this piece and that I can upload it… so I will try to use some of that discipline I mentioned above, and just write what I can, now, in this moment, so I can share it with you.
When dealing with a global pandemic of a new (to humans) viral pathogen, we have a few options ‘on the table’. We could attempt to stifle the virus by isolating those with infection, preventing the virus from finding new hosts until the chain of infection completely dies out, we could take no preemptive actions, allowing the virus to work its way through the population until everyone has been exposed and acquired a natural immunity to reinfection, or we could choose a third path, somewhere between those two options.
Are quarantines effective?
In order to know which strategy is most appropriate, we need to know if we can identify people with infection before they pass the infection to others, and isolate them until we know they are no longer infectious. We need to know the fatality rate from this virus. We need to know how much medical support symptomatic people will require, and in what time span that support will be required. In other words, we need to know how fast and hard the virus will move through the population.
With COVID-19, we already know that people can be infectious before they show symptoms. We are now learning that people can be infected and infectious and never show symptoms, and that it is possible that people who have had symptoms may still be infectious after they recover. The best datasets to look at for this information are coming from research on early infections in China, the passengers on the Diamond Princess cruise ship, Japanese evacuees repatriated from Wuhan, and just in the last few days, data from one specific town in Italy (Vo, near Padua) and, of all places, Iceland.
Looking at data from the Diamond Princess cruise ship, we can see how incubation periods can confuse and defeat quarantine periods. A passenger who disembarked the Diamond Princess on around January 26th was diagnosed with COVID-19 on February 1. On February 4th, the ship went into full quarantine (for the passengers, not for the crew), and on that day10 people were diagnosed with COVID-19. Full quarantine lasted until February 19th, when countries started to repatriate passengers, with an additional 14 day mandatory quarantine period for the returning passengers upon arrival in their home country. By February 19th, 621 people from the ship tested positive for the virus. This number eventually reached 712 as repatriated individuals were subsequently diagnosed with COVID-19. Because we now know that the incubation period for this virus can be as little as 2, and more than 14 days in at least 6% of people who show symptoms, most of the people who were infected COVID-19 on the Diamond Princess were likely infected before quarantine measures were put in place.
It can take at least 14 days for those who are already infected to show symptoms. Is a 14 day quarantine period enough to ‘kill’ the spread of this virus? For that, we can look to the town of Vo, Italy. In this town all 3,300 inhabitants were tested for coronavirus infection. The study began on March 6th, when that town had 90 COVID-19 cases, and when the entire town was put under a 14 day quarantine. Testing revealed 66 more positive people in addition to the 90 known cases. After the 14 day quarantine, repeated testing revealed that 6 of those people were still positive for coronavirus. Another study, from China, showed that roughly half of patients still had viral RNA in their blood three weeks (21 days) after symptom onset. While presence of viral RNA does not prove these people are infectious, it suggests that they could be.
What can we learn from this? A quarantine period can stop the spread of this virus, but it must last longer than fourteen days, because it can take more than fourteen days from day of infection for individuals to even begin feeling symptoms, and even longer still to clear the virus from their system.
What about “silent” infections?
We know that people can shed viral particles at least 2 to 3 days before they feel symptomatic. We also now know that some people never feel symptomatic. Maybe they feel off for a day or two, or have a stuffy nose, or a headache, or intestinal problems, things they wouldn’t recognize as a COVID-19 infection. Or maybe they never have symptoms at all. And those asymptomatic people can also be infectious. In one study, ‘undocumented’ infections were the source of infection for 79% of documented cases.
To understand what percentage of the population may be infected by asymptomatic, we can look to data again from the Diamond Princess, from citizens Japan repatriated from Wuhan, and to Iceland. From data collected from the Diamond Princess cruise ship passengers and a population of Japanese citizens evaluated from Wuhan, the percentage of asymptomatic infections was calculated to be anywhere between 18-33% of all infections, or even higher.
Iceland is ahead of most nations in testing its citizens for infection. Because Iceland is a small nation (364,000 inhabitants) and, being an island, physically isolated, it is a has a large but ‘controlled’ population to gather data from (by ‘controlled’ I mean that its people stay put and are more likely to all follow any state policies about coronavirus response). Iceland is currently carrying out large scale testing for coronavirus infection in its general population, regardless of the presence of symptoms. As of today (March 29th) they have tested 14,634 people and found 963 confirmed infections, 19 of whom are hospitalized, 6 of those in intensive care. More than half of the people testing positive do not have symptoms (remember, some may still progress to being symptomatic) and many of the remaining individuals have mild, cold-like symptoms.
Are quarantines both ineffective and unnecessary?
These data may lead us to think “great, this virus isn’t that bad! Many people who get it never feel symptoms, or at least symptoms that are very bad… why are we worried at all?” We might decide that the ‘pain’ of trying to stop or slow the virus by completely shutting everything down for more than three weeks is much worse than the ‘pain’ of allowing people to become infected. But that decision would be based on incomplete data. Discipline, remember? Discipline to take a cautious and steady approach to looking at the data, all the available data, before coming to a decision. Discipline to realize there is no way forward that does not cause damage in some way, and discipline to make the best choice while fully acknowledging the damage it will cause.
And so we must look at what this virus does to the portion of people who do feel symptoms, and what effect that will have on our health care resources, and more importantly, our health care workers. Can our medical infrastructure handle the number of cases that will occur in, in the time frame it will occur, if we remove or reduce quarantines? And at what cost? This virus will kill some people, regardless of how we approach it. It already has. But if infection rates are high, we will overrun our hospitals, and additional people will die due to lack of available care. To face those realities, and still make decisions, we need to know how many cases will occur, in what time frame, and what the fatality rate might be with and without hospitalization and ICU treatments for patients with severe symptoms.
What if we just let coronavirus run ‘free’?
We already know this new coronavirus causes severe symptoms in a subset of people, symptoms that require hospital interventions like oxygen or even being on a ventilator. Its fatality rate ranges widely, with Korea reporting fatalities at less than 1%, and Italy reporting an over 10% fatality rate. It moves quickly through populations, with one infectious person passing it to on average about three new people.
Of the people with COVID-19 who experience symptoms, 80% experience mild to moderate symptoms, which are described as being somewhere between a bad cold and a bad flu. These patients generally do not require medical interventions, but may feel quite ill for about week, with improvement around the 8th day of experiencing symptoms, and full recovery within about two weeks. Many patients experience less intense symptoms until about day 8, at which point they either begin to feel better or progress quickly into severe or critical symptoms.
About 14% of symptomatic people experience severe symptoms – difficulty breathing, chest tightness and pain. These patients will likely require hospitalization and supplemental oxygen. The remaining 6% of symptomatic people experience critical symptoms and will need intensive interventions such as being put on a mechanical ventilator. The recovery time for patients with severe to critical symptoms can be 3-6 weeks, or more.
The likelihood of a person with a known infection experiencing severe or critical symptoms varies with age. Data from early cases in mainland China shows what percent of people in each age bracket developed severe or critical symptoms, listed below. Let me stress that later data shows that fatalities can occur in all age brackets, and no one is entirely safe from this virus.
0%: 0-9years
2%: 10-19 years
11%: 20-29 years
17%: 30-39 years
21%: 40-49 years
28%: 50-59 years
36%: 60-69 years
51%: 70-79 years
67%: 80+ years
To predict what our health care workers and medical facilities will face, we need to know how fast the virus will move through the population, which will tell us how many people are sick at the same time, and how many of those people will require hospitalization and ICU beds. For the first number we need to look at the rate of infection, or how fast the number of new cases grows each day. For the second number we need to look at the rate of infection and the demographics of our population. How many people are in each age bracket? How many of them will likely get sick enough to require hospitalization? Supplemental oxygen? ICU beds and ventilators? Italy has been especially hard hit by this virus, with a 10% fatality rate, in no small part due to 23% of its population being older than 64, and 12% being older than 74. The average age of those dying from COVID-19 in Italy is 78 years old. Most of Italy’s coronavirus cases require intensive medical intervention, and their healthcare system, while very good, cannot keep up with demand, meaning at least some of these deaths could have been prevented.
The very short version or ‘punchline’ of these data are that we definitely will not have sufficient hospital beds, ICU beds and ventilators for the number of people who will become sick unless we drastically slow our rate of infection. And I mean that for resources in the U.S. and in any country on the planet. I am not a health care worker; I do not know exactly how many beds, ventilators, and other resources are available. But I do know that our resources are not unlimited, especially when thinking of our health care workers. This virus moves fast. Because it can be transmitted by asymptomatic people, it is nearly impossible to prevent infections in places where people come into contact with each other, and the number of infections will rise exponentially each day unless extreme social distancing policies are put into place.
Infection rates and speed of viral spread
To drive home this point, let’s look at current infection rates in the U.S. as an example. On March 10th, the number of infections in the U.S. (700). Using the infection rate in Italy (33% at that time), I made a rough model to predict how quickly the numbers in the U.S. would rise. I have to stress the word rough here. This model does not take into account barriers to infection such as like isolation or people who gain immunity to the infection, providing increasing amounts of ‘herd immunity’. It simply predicts the number of infections that will be reported the following day by multiplying the current number of infections by the infection rate (here, 33%) and assuming that number will be the number of new infections found on the next day. For example, I calculated that the number of infections for March 11 would be 931: the 700 original plus 231 new infections (33% of 700). Assuming the U.S. followed this same rate of infections (33% more each day), this rough calculation predicted the virus would infect the entire U.S. by the end of April 2020. Scary, right? Could our healthcare facilities meet the needs of almost everyone in the country getting sick within about seven weeks? Especially when people with severe or critical infections may require hospitalization for weeks?
But it turns out my calculations were wrong, because the U.S. did not show a 33% infection rate. Instead, from March 18 to March 21 our infection rate average 60%, with a high of 67% on March 19th. Given a 60% infection rate, a rough estimate of infection numbers puts us at everyone in the country being infected by April 12th. If the numbers for a 33% infection rate were scary, the ones for a 60% infection rate are simply unacceptable. We truly can’t, as a country, ever hope to handle the fallout from a dangerous virus with an infection rate like that. If 40% of the population will be asymptomatic (that is a rough guess, not a ‘real’ number), and 20% of the symptomatic people will require hospitalization, this gives us a (very rough) estimate of 40 million people requiring hospitalization within the month of April, or the number of people in our most populous state, California!!
So what is the “answer”?
And so I hope we can all see that, while it is very difficult to fully shut this virus down with quarantines, we definitely have to implement social policies that will substantially reduce its infection rate. And we have. In mid-March, a number of towns and states started implementing ‘social-distancing’ and ‘shelter-in-place’ policies. My own town put a social-distancing policy into effect on March 14th. New York City did so on March 20th. These policies are hard on people. Loss of income, loss of freedom, people may not be able to purchase food, businesses struggle, and workers may lose their jobs AND health care.
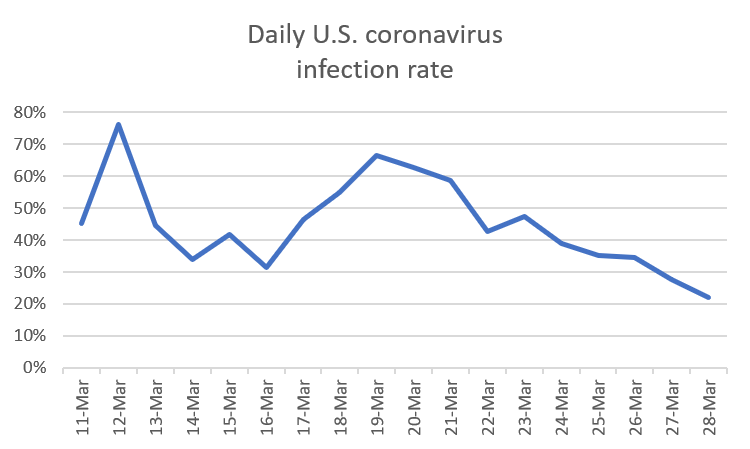
It is especially hard to maintain the discipline needed to carry out these policies when the numbers just keep going up. Remember, this virus has an incubation time of 2-16 days, or more. Even if everyone self-isolated simultaneously, ‘new’ infections would keep showing up as already infected people started developing symptoms. Each day we see the news reports of scary numbers of new infections, but what we have to remember is that it is the percent of increase that matters, not the actual number itself. For example, from March 27th to March 28th, the U.S. recorded about 20,000 new infections, which sounds huge. However, this was only a 22% increase from the previous day, much lower than the 67% we saw from March 18 to March 19 (which was only 4,500 new infections).
Yes, the rate of infection in the U.S. is showing signs of dropping, a direct result of social distancing and shelter in place policies (see graph at end of blog). A lower rate of infections means that the number of new infections will be spread out over more time, though the model still predicts (with a 22% infection rate) that the entire U.S. could be infected by around mid-May. If we can bring the infection rate down to 15%, that number becomes May 24th, and if we bring it down to 10%, that number becomes June 20th. Of course, these numbers will stretch even later as more people recover from infection and become part of ‘herd immunity’, blocking pathways for new infections.
But the question is – how long can we afford to keep these social policies in place? Is there a balance between quarantines and shutdowns, which cause serious damage to people’s finances and to economies, and infection rates? That is exactly where we currently are in policy making decisions. And there is definitely no clear or easy answer. Err to far on one side, and infection rates quickly increase, leaving hospital systems overrun, resulting in additional fatalities. Err to far on the other side, and damage to economies and personal financial status will be more extreme than absolutely necessary. So what can we as individuals do? We need to exercise discipline, and patience. We need to let our policy makers know that we understand why social distancing and business shutdowns are necessary. We need to resist recklessly pushing for being released from shelter-in-place policies. And yet we still must acknowledge that we may need to relax policies periodically to reduce financial damage, even though that will result in additional infections, and yes, fatalities.